
Free Analytics-Con-301 Exam Files Downloaded Instantly UPDATED [2026]
100% Pass Guaranteed Free Analytics-Con-301 Exam Dumps
NEW QUESTION # 29
A client has a Tableau Cloud deployment. Currently, dashboards are available only to internal users.
The client needs to embed interactive Tableau visualizations on their public website.
Data is < 5,000 rows, updated infrequently via manual refresh.
Cost is a priority.
Which product should the client use?
- A. Tableau Cloud licensed per user
- B. Tableau Public
- C. Tableau Embedded Analytics
- D. Tableau Server licensed per core
Answer: B
Explanation:
Comprehensive and Detailed Explanation From Exact Extract:
Tableau documentation explains:
Tableau Public
* Free platform.
* Allows public sharing and embedding of fully interactive dashboards.
* Ideal for small datasets and infrequent updates.
* Does not require user-based licensing.
* Embedding is unrestricted because all content is publicly visible.
This perfectly matches the scenario:
# Public-facing website
# Low cost priority
# Small dataset
# Manual, infrequent updates
Why the other options are incorrect:
A). Tableau Cloud (per user)
* Requires paid licenses.
* Does not allow unrestricted public embedding without expensive add-ons.
* Designed for secure internal use, not public web-wide embedding.
C). Tableau Embedded Analytics
* A paid embedding solution requiring proper licensing.
* Designed for large-scale, secure, programmatic embedding - too costly for this use case.
D). Tableau Server (per core)
* Requires server infrastructure & licensing.
* Far more expensive than Tableau Public.
Thus, Tableau Public is the correct, cost-effective solution.
* Tableau Public documentation describing free embedding for public websites.
* Comparison guides showing Tableau Cloud/Server require licensing for embedding.
* Public vs. Enterprise Tableau deployment best practices.
NEW QUESTION # 30
A client has many published data sources in Tableau Server. The data sources use the same databases and tables. The client notices different departments give different answers to the same business questions, and the departments cannot trust the data. The client wants to know what causes data sources to return different data.
Which tool should the client use to identify this issue?
- A. Ask Data
- B. Tableau Prep Conductor
- C. Tableau Resource Monitoring Tool
- D. Tableau Catalog
Answer: D
Explanation:
The Tableau Catalog is part of the Tableau Data Management Add-on and is designed to help users understand the data they are using within Tableau. It provides a comprehensive view of all the data assets in Tableau Server or Tableau Online, including databases, tables, and fields. It can help identify issues such as data quality, data lineage, and impact analysis. In this case, where different departments are getting different answers to the same business questions, the Tableau Catalog can be used to track down inconsistencies and ensure that everyone is working from the same, reliable data source.
References: The recommendation for using Tableau Catalog is based on its features that support data discovery, quality, and governance, which are essential for resolving data inconsistencies across different departments12.
When different departments report different answers to the same business questions using the same databases and tables, the issue often lies in how data is being accessed and interpreted differently across departments. Tableau Catalog, a part of Tableau Data Management, can be used to solve this problem:
Visibility: Tableau Catalog gives visibility into the data used in Tableau, showing users where data comes from, where it's used, and who's using it.
Consistency and Trust: It helps ensure consistency and trust in data by providing detailed metadata management that can highlight discrepancies in data usage or interpretation.
Usage Metrics and Lineage: It offers tools for tracking usage metrics and understanding data lineage, which can help in identifying why different departments might see different results from the same underlying data.
References:
Tableau Catalog Usage: The Catalog is instrumental in providing a detailed view of the data environment, allowing organizations to audit, track, and understand data discrepancies across different users and departments.
NEW QUESTION # 31
Use the following login credentials to sign in
to the virtual machine:
Username: Admin
Password:
The following information is for technical
support purposes only:
Lab Instance: 40201223
To access Tableau Help, you can open the
Help.pdf file on the desktop.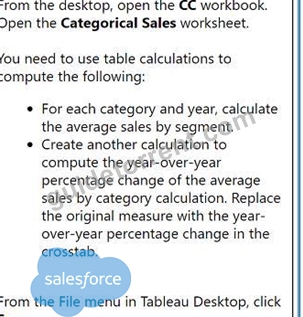
From the desktop, open the CC workbook.
Open the Categorical Sales worksheet.
You need to use table calculations to
compute the following:
. For each category and year, calculate
the average sales by segment.
. Create another calculation to
compute the year-over-year
percentage change of the average
sales by category calculation. Replace
the original measure with the year-
over-year percentage change in the
crosstab.
From the File menu in Tableau Desktop, click
Save.
Answer:
Explanation:
See the complete Steps below in Explanation:
Explanation:
To compute the required calculations and update the worksheet in Tableau Desktop, follow these steps:
* Compute Average Sales by Segment for Each Category and Year:
* Open the CC workbook and navigate to the Categorical Sales worksheet.
* Drag the 'Sales' field to the Rows shelf if it's not already there.
* Drag the 'Segment' field to the Rows shelf as well, placing it next to 'Category' and 'Year'.
* Right-click on the 'Sales' field in the Rows shelf and select 'Quick Table Calculation' > 'Average'.
This will compute the average sales for each segment within each category and year.
* Create a Calculation for Year-over-Year Percentage Change:
* Right-click in the data pane and select 'Create Calculated Field'.
* Name the calculated field something descriptive, e.g., "YoY Sales Change".
* Enter the formula to calculate the year-over-year percentage change:
(ZN(SUM([Sales])) - LOOKUP(ZN(SUM([Sales])), -1)) / ABS(LOOKUP(ZN(SUM([Sales])), -1))
* Click 'OK' to save the calculated field.
* Replace the Original Measure with the Year-over-Year Percentage Change in the Crosstab:
* Remove the original 'Sales' measure from the view by dragging it off the Rows shelf.
* Drag the newly created "YoY Sales Change" calculated field to the Rows shelf where the 'Sales' field was originally.
* Format the "YoY Sales Change" field to display as a percentage. Right-click on the field in the Rows shelf, select 'Format', and adjust the number format to percentage.
* Save Your Changes:
* From the File menu, click 'Save' to ensure all your changes are stored.
References:
Tableau Help: Offers guidance on creating calculated fields and using table calculations.
Tableau Desktop User Guide: Provides instructions on formatting and saving worksheets.
These steps allow you to manipulate data within Tableau effectively, using table calculations to analyze trends and changes in sales data by category and segment over years.
NEW QUESTION # 32
A client wants guidance for Creators to build efficient extracts from large data sources.
What are three Tableau best practices that the Creators should use? Choose three.
- A. Use aggregate data for visible dimensions, whenever possible.
- B. Hide all unused fields.
- C. Keep only the data required for analysis by using extract filters.
- D. Include all the data from the original data source in the extract.
- E. Use only live connections as they are always faster than extracts.
Answer: A,B,C
Explanation:
To build efficient extracts from large data sources, it is crucial to minimize the load and optimize the performance of the extracts:
A . Keep only the data required for analysis by using extract filters: This best practice involves using filters to reduce the volume of data extracted, thus focusing only on the data necessary for analysis.
B . Use aggregate data for visible dimensions, whenever possible: Aggregating data at the time of extraction reduces the granularity of the data, which can significantly improve performance and reduce the size of the extract.
E . Hide all unused fields: Removing fields that are not needed for analysis from the extract reduces the complexity and size of the data model, which in turn enhances performance and speeds up load times.
These practices are endorsed in Tableau's official documentation and training sessions as effective ways to enhance the performance of Tableau extracts and optimize dashboard responsiveness.
NEW QUESTION # 33
A client has a published dashboard. They change the dashboard and then republish it. Now, users report that their web browser bookmarks to the dashboard are broken.
What are two possible causes for this issue? Choose two.
- A. Tableau Server was upgraded.
- B. The dashboard was published to a different project.
- C. The dashboard was published with a new name.
- D. New credentials were embedded into the data source.
Answer: B,C
Explanation:
When a client republishes a dashboard after making changes and users report broken bookmarks, the likely causes include:
The dashboard was published to a different project: Changing the project location alters the URL path, causing bookmarks to point to a now non-existent dashboard location.
The dashboard was published with a new name: Altering the dashboard's name changes its URL, resulting in broken bookmarks as the previous URL no longer leads to the intended dashboard.
NEW QUESTION # 34
A consultant builds a report where profit margin is calculated as SUM([Profit]) / SUM([Sales]). Three groups of users are organized on Tableau Server with the following levels of data access that they can be granted.
. Group 1: Viewers who cannot see any information on profitability
. Group 2: Viewers who can see profit and profit margin
. Group 3: Viewers who can see profit margin but not the value of profit Which approach should the consultant use to provide the required level of access?
- A. Use user filters to access data on profitability to all groups. Then, create a calculated field that allows visibility of profit value to Group 2 and use the calculation in the view in the report.
- B. Specify with user filters in each view individuals who can see profit, profit margin, or none of these.
- C. Use user filters to allow only Groups 2 and 3 access to data on profitability. Then, create a calculated field that limits visibility of profit value to Group 2 and use the calculation in the view in the report.
- D. Specify in the row-level security (RLS) entitlement table individuals who can see profit, profit margin, or none of these. Then, use the table data to create user filters in the report.
Answer: C
Explanation:
The approach of using user filters to control access to data on profitability for Groups 2 and 3, combined with a calculated field that restricts the visibility of profit value to only Group 2, aligns with Tableau's best practices for managing content permissions. This method ensures that each group sees only the data they are permitted to view, with Group 1 not seeing any profitability information, Group 2 seeing both profit and profit margin, and Group 3 seeing only the profit margin without the actual profit values. This setup can be achieved through Tableau Server's permission capabilities, which allow for detailed control over what each user or group can see and interact with12.
References: The solution is based on the capabilities and permission rules that are part of Tableau Server's security model, as detailed in the official Tableau documentation12. These resources provide guidance on how to set up user filters and calculated fields to manage data access levels effectively.
NEW QUESTION # 35
A data analyst sets up a calculation to filter a dashboard so that it displays only the users' information. The dashboard will then be published to Tableau Cloud.
The data analyst plans to use the following calculation to filter the data: USERNAME() = [Correct Answer] Which column in the table below should the data analyst reference in the calculation?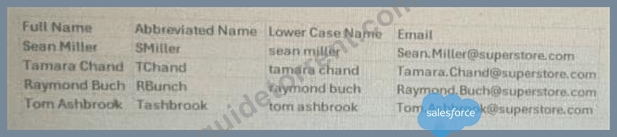
- A. Abbreviated Name
- B. Email
- C. Lower case Name
Answer: B
Explanation:
When dashboards are published to Tableau Cloud, the function USERNAME() returns the user's Tableau Cloud username, which is the email address associated with their Tableau Cloud account.
Tableau documentation states:
* On Tableau Cloud, the value returned by USERNAME() is always the user's email address.
* Row-Level Security (RLS) is typically implemented using a comparison of USERNAME() to an email field in the data source.
* For secure filtering, the field compared to USERNAME() must match the authentication identity exactly.
Looking at the provided table:
* "Abbreviated Name" contains short custom codes like "SMiller," which do not match Tableau Cloud usernames.
* "Lower Case Name" contains names like "sean miller," which also do not match Tableau Cloud usernames.
* "Email" contains the full email address for each user, such as "[email protected]," which is the only field that corresponds to what USERNAME() returns in Tableau Cloud.
Therefore, the correct field to reference is Email.
* Tableau Cloud authentication documentation stating USERNAME() returns the user's email address.
* Row-Level Security setup guidance recommending the comparison USERNAME() = [Email Field].
* Tableau security practices indicating only the email column will match USERNAME() values on Tableau Cloud.
NEW QUESTION # 36
A client needs to design row-level security (RLS) measures for their reports. The client does not currently have Tableau Data Management Add-on, and it may be an option in the future.
What should the consultant recommend as the safest and easiest way to manage for the long term?
- A. Create User filters based on data policies and apply them to views using set filters and option Server
/Create User Filter. - B. Create User filters based on data policies and apply them to a published data source.
- C. Create User filters for each report using a table joined to its data source and using the option Apply to All Sheet Using the Data Source.
- D. Create User filters in each view of each report using set filters and option Server/Create User Filter.
Answer: B
Explanation:
For implementing row-level security (RLS) without the Tableau Data Management Add-on, the best approach is to integrate user filters into the published data source:
* Creating User Filters on Published Data Source: This method involves defining user filters that apply directly to the data source before it is published to the Tableau Server. This ensures that any workbook or view leveraging this data source inherently respects the row-level security settings.
* To implement this, create a calculated field in Tableau that defines the security logic, typically using a formula that references user functions (like USERNAME() or ISMEMBEROF()). Drag this field to the Filters shelf and configure it to match the security rules (who can see what data).
* Once configured, publish the data source to Tableau Server with these filters in place. This approach centralizes security management, making it easier to maintain and update security policies as they are applied universally to all workbooks using this data source.
This strategy is safe as it reduces the risk of accidental data exposure through individual workbook misconfiguration and simplifies long-term maintenance of security policies.
References
This method follows Tableau's best practices for implementing row-level security as detailed in Tableau's security management resources. It ensures robust, maintainable security measures that scale with organizational needs without requiring additional add-ons.
NEW QUESTION # 37
A client builds a dashboard that presents current and long-term stock measures. Currently, the data is at a daily level. The data presents as a bar chart that presents monthly results over current and previous years. Some measures must present as monthly averages.
What should the consultant recommend to limit the data source for optimal performance?
- A. Limit data to current and previous years, move calculating averages to data layer, and aggregate dates to monthly level.
- B. Limit data to current and previous years as well as to the last day of each month to eliminate the need to use the averages.
- C. Move calculating averages to data layer and aggregate dates to monthly level.
- D. Limit data to current and previous years and leave data at daily level to calculate the averages in the report.
Answer: A
Explanation:
For optimal performance, it is recommended to limit the data to what is necessary for analysis, which in this case would be the current and previous years. Moving the calculation of averages to the data layer and aggregating the dates to a monthly level will reduce the granularity of the data, thereby improving the performance of the dashboard. This approach aligns with best practices for optimizing workbook performance in Tableau, which suggest simplifying the data model and reducing the number of records processed12.
References: The recommendation is based on the guidelines provided in Tableau's official documentation on optimizing workbook performance, which includes tips on data management and aggregation for better performance12.
NEW QUESTION # 38
A consultant plans a Tableau deployment for a client that uses Salesforce. The client wants users to automatically see Tableau views of regional sales filtered by customer as soon as the users sign into Salesforce.
Which approach should the consultant use to deliver the final visualization?
- A. Create a list of URLs that the users can click in Salesforce.
- B. Create subscriptions for each view to deliver reports by email.
- C. Publish to Tableau Mobile for viewing.
- D. Embed views into Salesforce.
Answer: D
Explanation:
To ensure that users automatically see Tableau views of regional sales filtered by customer as they sign into Salesforce, embedding the views directly into Salesforce is most effective:
Embedding Views: Tableau provides capabilities to embed its dashboards into web applications such as Salesforce. This approach ensures that the visualization is part of the Salesforce user interface, enhancing user experience by not requiring users to navigate away from Salesforce to view the data.
Implement this by using Tableau's embedding code, which can be generated from the Tableau Server for each specific view. Place this embed code into the Salesforce Visualforce pages or use Salesforce Canvas to integrate these views seamlessly.
This setup allows the Tableau views to inherit user credentials from Salesforce, enabling personalized data visualization based on the user's access rights and region, directly aligned with their Salesforce login session.
References
The embedding technique is documented in both Tableau's and Salesforce's official integration guides, which provide step-by-step instructions on embedding Tableau views into Salesforce platforms.
NEW QUESTION # 39
SIMULATION
From the desktop, open the CC workbook.
Open the City Pareto worksheet.
You need to complete the Pareto chart to show the percentage of sales compared to the percentage of cities. The chart must show references lines to visualize how the data compares to the Pareto principle.
From the File menu in Tableau Desktop, click Save.
Answer:
Explanation:
See the complete Steps below in Explanation
Explanation:
To complete the Pareto chart in the "City Pareto" worksheet of your Tableau Desktop and add reference lines to illustrate how the data compares to the Pareto principle, follow these steps:
Open the CC Workbook and Access the Worksheet:
From the desktop, double-click on the CC workbook to open it in Tableau Desktop.
Navigate to the City Pareto worksheet by selecting its tab at the bottom of the window.
Construct the Pareto Chart:
Ensure that sales data is aggregated by city. If not, drag the 'City' dimension to the Columns shelf and the 'Sales' measure to the Rows shelf.
Sort the sales data in descending order to properly align the cities according to their sales contribution.
To create a running total of sales, right-click on the 'Sales' measure on the Rows shelf, select 'Quick Table Calculation', and choose 'Running Total'.
Drag the 'Number of Records' field to the Rows shelf next to the Sales running total. Right-click on it, select 'Quick Table Calculation', and choose 'Running Total'. Set its calculation to 'Percent of Total' from the 'Edit Table Calculation' option to represent the percentage of cities.
Add Reference Lines for the Pareto Principle:
Click on the Analytics tab in the sidebar.
Drag a 'Reference Line' element and drop it onto the chart area.
Set the Reference Line for the Sales axis at 80% to represent the typical Pareto cutoff where 80% of effects come from 20% of causes.
Add another Reference Line on the axis representing the percentage of cities, set at 20%, to visually assess the Pareto principle.
Adjust the Appearance of the Chart:
Format the reference lines by right-clicking on them, selecting 'Edit', and choosing a distinct style or color to make them stand out.
Ensure the chart is clear and labels are appropriately adjusted for easy understanding of the data visualization.
Save Your Changes:
From the File menu, click 'Save' to ensure all your changes are stored.
References:
Tableau Help: Offers detailed guidance on creating Pareto charts and adding reference lines.
Tableau Visualization Best Practices: Provides tips on effectively displaying cumulative data and principles such as Pareto.
By following these steps, you will have successfully enhanced the City Pareto worksheet to include a complete Pareto chart with reference lines that illustrate how the sales data compares to the Pareto principle, making it easier to analyze and communicate the distribution of sales across cities.
NEW QUESTION # 40
A consultant used Tableau Data Catalog to determine which workbooks will be affected by a field change.
Catalog shows:
* Published Data Source # 7 connected workbooks
* Field search (Lineage tab) # 6 impacted workbooks
The client asks: Why 7 connected, but only 6 impacted?
- A. The field being altered is not used in the seventh workbook.
- B. The seventh workbook is connected via Custom SQL so it didn't appear in the list.
- C. The consultant lacked sufficient permissions to see the seventh workbook.
- D. The field is used twice in a single workbook.
Answer: A
Explanation:
Comprehensive and Detailed Explanation From Exact Extract:
Key Tableau Catalog behaviors:
* Connected workbooks = any workbook linked to the published data source.
* Impacted workbooks = only workbooks that use the specific field.
* If a workbook connects to the data source but never uses the field, it appears as "connected" but not impacted.
This explains EXACTLY why:
* 7 workbooks are connected
* Only 6 use the changed field
* Therefore only 6 are impacted
This matches Option C.
Why the other options are incorrect:
A). Field used twice
Still counts as one workbook - does not explain discrepancy.
B). Permission issue
If permissions blocked visibility, the data source would not list 7 connections.
D). Custom SQL use
Catalog can still detect field usage through metadata lineage; Custom SQL does NOT hide workbook dependency.
Thus, only Option C logically explains the scenario.
* Data Catalog lineage rules: "Connected vs. Impacted" distinction.
* Field-level impact analysis documentation.
* Workbook dependency logic within Tableau Catalog.
NEW QUESTION # 41
A client wants to flag orders that have sales higher than the regional average.
Which calculated field will produce the required result?
- A. { FIXED [Order ID] : SUM([Sales]) }
>
{ INCLUDE [Region] : AVG({ FIXED [Order ID] : SUM([Sales]) }) } - B. { FIXED [Order ID] : SUM([Sales]) }
>
{ FIXED [Region] : SUM([Sales]) } - C. { FIXED [Order ID] : SUM([Sales]) }
>
{ FIXED [Region] : AVG({ FIXED [Order ID] : SUM([Sales]) }) } - D. [Sales]
>
{ FIXED [Order ID] : SUM([Sales]) }
Answer: C
Explanation:
To flag orders with sales higher than the regional average, the correct calculated field would compare the sum of sales for each order against the average sales of all orders within the same region:
* Correct Formula: { FIXED [Order ID] : SUM([Sales]) } > { FIXED [Region] : AVG({ FIXED
[Order ID] : SUM([Sales]) }) }
* This calculation uses a Level of Detail (LOD) expression:
* The left part of the formula { FIXED [Order ID] : SUM([Sales]) } calculates the total sales for each individual order.
* The right part { FIXED [Region] : AVG({ FIXED [Order ID] : SUM([Sales]) }) } calculates the average sales per order within each region.
* The > operator is used to compare these two values to determine if the sales for each order exceed the regional average.
References
This formula utilizes Tableau's LOD expressions to perform complex comparisons across different dimensions of the data, as explained in Tableau's official training materials on LOD calculations.
NEW QUESTION # 42
During a Tableau Cloud implementation, a Tableau consultant has been tasked with implementing row-level security (RLS). They have already invested in implementing RLS within their own database for their legacy reporting solution. The client wants to know if they will be able to leverage their existing RLS after the Tableau Cloud implementation.
Which two requirements should the Tableau consultant share with the client? Choose two.
- A. Both live and extract connections can be used.
- B. Only live data connections can be used.
- C. The Tableau Cloud username must exist in the database.
- D. The RLS in database option must be configured in Tableau Cloud.
Answer: B,C
Explanation:
Comprehensive and Detailed Explanation From Exact Extract:
In Tableau Cloud, database-level RLS can be used only with live connections because:
* Tableau Cloud issues SQL queries using the logged-in user's identity.
* Extracts break RLS because data is pulled out of the database and stored in Tableau's hyper file.
* To leverage existing RLS rules, Tableau must query the database directly for the user.
Therefore:
Requirement 1:
The Tableau Cloud username (email) must exist in the database
so that the database can enforce RLS using the authenticated identity.
Requirement 2:
Only live data connections support database-native RLS.
Extracts bypass database security and therefore cannot use RLS defined in the database.
Option D is incorrect because RLS is enforced in the database, not configured in Tableau Cloud.
Option B is incorrect because extracts cannot use database RLS.
Thus, correct answers are A and C.
* Tableau Cloud live connection security requirements.
* Database RLS documentation requiring matching database user identities.
* Explanation that extracts bypass database permission systems.
NEW QUESTION # 43
A client is searching for ways to curate and document data in order to obtain data lineage. The client has a data source connected to a data lake.
Which tool should the consultant recommend to meet the client's requirements?
- A. Tableau Prep Conductor
- B. Tableau Catalog without Tableau Data Management Add-on
- C. Tableau Catalog with Tableau Data Management Add-on
- D. Tableau Catalog with Tableau Server Management Add-on
Answer: C
Explanation:
To effectively curate and document data for obtaining data lineage, particularly from a data source connected to a data lake, the recommended tool is:
* Tableau Catalog with Tableau Data Management Add-on: This add-on enhances the capabilities of Tableau Catalog, providing extensive features for data management, including detailed data lineage, impact analysis, and metadata management.
* Functionality: The Tableau Catalog with the Data Management Add-on allows users to see the full history and lineage of the data, trace its usage across all Tableau content, and understand dependencies.
It also facilitates better governance and transparency in data handling.
* Why Choose this Tool: For a client needing comprehensive data lineage and documentation capabilities, this add-on ensures that data stewards and users can maintain and utilize a well-managed data environment. It supports robust data governance practices necessary for large and complex data ecosystems like those typically associated with data lakes.
References
The recommendation is based on the functionalities offered by the Tableau Data Management Add-on, as described in Tableau's official documentation on managing and documenting data sources for enhanced governance and operational efficiency.
NEW QUESTION # 44
A client wants to migrate their Tableau Server to Tableau Cloud. The Tableau Server is configured with three sites: Finance, Strategy, and Marketing. A consultant must provide a solution that minimizes user impact and costs.
Which configuration should the consultant recommend for Tableau Cloud to meet the client's requirements?
- A. One Tableau Cloud instance with two sites for Strategy and Marketing, and one Tableau Server instance for Finance
- B. One Tableau Cloud instance configured with all workbooks in a single project
- C. One Tableau Cloud instance configured with a Finance project folder, Strategy project folder, and Marketing project folder
- D. Three separate Tableau Cloud instances for Finance, Strategy, and Marketing
Answer: C
Explanation:
To minimize user impact and costs while migrating from Tableau Server to Tableau Cloud with multiple sites, the best solution is:
Single Tableau Cloud Instance with Multiple Projects: Instead of multiple sites which could imply higher management overhead and possibly higher costs, configuring one Tableau Cloud instance with different project folders for each former site (Finance, Strategy, Marketing) is most efficient.
Benefits: This setup maintains organizational separation of data and access similar to having different sites but leverages the unified management and simplicity of a single cloud instance. It reduces complexity in user access management and integration points.
Implementation: Each project folder acts like a mini-site within the larger instance, where specific permissions and content can be managed independently, akin to the original server setup but within a single cloud-based environment.
References
This recommendation is in line with best practices for cloud migration focusing on consolidation and cost efficiency, as suggested in Tableau's official documentation for cloud migration strategies.
NEW QUESTION # 45
A client calculates the percent of total sales for a particular region compared to all regions.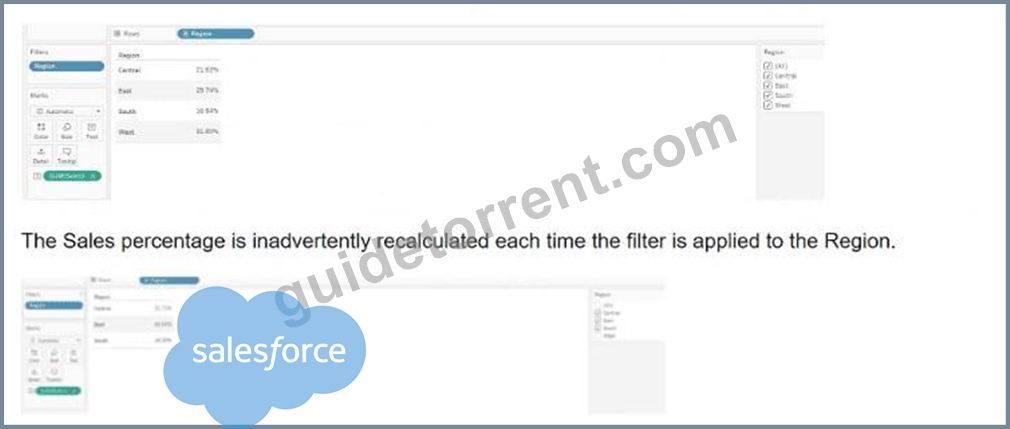
Which calculation will fix the automatic recalculation on the % of total field?
- A. {FIXED [Region]:sum([Sales])}/SUM([Sales]}
- B. {FIXED [Region]:[Sales]}/{FIXED: SUM([Sales])}
- C. {FIXED [Region]:sum([Sales])}
- D. {FIXED [Region]:sum([Sales])}/{FIXED :SUM([Sales])
Answer: A
Explanation:
To correctly calculate the percent of total sales for a particular region compared to all regions, and to ensure that the calculation does not get inadvertently recalculated with each region filter application, the recommended calculation is:
* {FIXED [Region]: sum([Sales])}: This part of the formula computes the sum of sales for each region, regardless of any filters applied to the view. It uses a Level of Detail expression to fix the sum of sales to each region, ensuring that filtering by regions won't affect the calculated value.
* SUM([Sales]): This part computes the total sum of sales across all regions and is recalculated dynamically based on the filters applied to other parts of the dashboard or worksheet.
* Combining the two parts: By dividing the fixed regional sales by the total sales, we get the proportion of sales for each region as compared to the total. This calculation ensures that while the denominator adjusts according to filters, the numerator remains fixed for each region, accurately reflecting the sales percentage without being affected by the region filter directly.
References
This calculation follows Tableau's best practices for using Level of Detail expressions to manage computation granularity in the presence of dashboard filters, as outlined in the Tableau User Guide and official Tableau training materials.
NEW QUESTION # 46
A client wants to provide sales users with the ability to perform the following tasks:
* Access published visualizations and published data sources outside the company network.
* Edit existing visualizations.
* Create new visualizations based on published data sources.
. Minimize licensing costs.
Which site role should the client assign to the sales users?
- A. Viewer
- B. Explorer (can publish)
- C. Creator
- D. Site Administrator
Answer: B
Explanation:
The Explorer (can publish) site role in Tableau is designed for users who need to access, edit, and create visualizations based on published data sources, even when they are outside the company network. This role allows users to perform web editing and save their work, making it suitable for sales users who need these capabilities. It is also a cost-effective option as it does not require the full capabilities and associated costs of the Creator license.
References: The information about the Explorer (can publish) role and its capabilities can be found in the official Tableau documentation on site roles and permissions12. This role is appropriate for users who need to interact with published content and create new visualizations without the need for full site administration or advanced content creation tools that come with the Creator role3.
NEW QUESTION # 47
A database contains two related tables at different levels of granularity. The client wants to make all data available in Tableau Prep at the original level of granularity.
Which two solutions in Tableau meet the client's requirements? Choose two.
- A. Two separate Published Data Sources, one for each table
- B. A single Published Data Source with a physical join between the two tables
- C. A single Published Data Source with a Relationship between the two tables
- D. A Virtual Connection to the database and both tables within it
Answer: A,D
Explanation:
Comprehensive and Detailed Explanation From Exact Extract:
The key requirement is:
# Data must remain at the original grain in Tableau Prep
# Tables are at different granularities
Tableau Prep does NOT support relationships, and automatically joins tables, which changes granularity (by duplicating or aggregating records).
Therefore, relationships (Option B) cannot preserve grain for Prep.
Also:
* A physical join (Option D) changes the grain by combining rows, often multiplying results when grain differs.
Only two options preserve the original granularity:
Option A - Two Separate Published Data Sources
Each data source represents one table.
In Tableau Prep, the user can choose:
* Use tables separately
* Join or clean them intentionally
* Keep each table at its own grain
This keeps all data at its native level.
Option C - Virtual Connection
A Virtual Connection:
* Publishes entire tables from the database
* Maintains each table independently at its native granularity
* Makes all tables available to Tableau Prep without altering grain
* Is specifically designed for governed, reusable multi-table access
Thus, it satisfies the requirement exactly.
Why the others are incorrect:
B - Relationship
Relationships only exist in Tableau Desktop logical layer, NOT in Tableau Prep.
Prep flattens the data # grain is lost.
D - Physical join
Always modifies granularity when tables differ, often causing row multiplication.
* Tableau Prep does not support logical relationships; only physical joins.
* Virtual Connections preserve original tables and governance.
* Published Data Sources can be separated to maintain original grain.
NEW QUESTION # 48
A client has a published data source in Tableau Server and they want to revert to the previous version of the data source. The solution must minimize the impact on users.
What should the consultant do to accomplish this task?
- A. Delete and recreate the data source manually.
- B. Select a previous version from Tableau Server, and then click Restore.
- C. Select a previous version from Tableau Server, download it, and republish that data source.
- D. Request that a server administrator restore a Tableau Server backup.
Answer: B
Explanation:
To minimize the impact on users when reverting to a previous version of a published data source in Tableau Server, the consultant should use the built-in revision history feature. By selecting a previous version from the revision history and clicking 'Restore', the data source will revert to that version without the need for a full server backup restoration or manual recreation of the data source. This process is quick and has the least amount of disruption to users.
References: The functionality and process for reverting to a previous version of a data source are outlined in Tableau's official documentation on working with content revisions1. This feature is part of Tableau Server's capabilities to manage and maintain data sources effectively21.
NEW QUESTION # 49
A client has many published data sources in Tableau Server. The data sources use the same databases and tables. The client notices different departments give different answers to the same business questions, and the departments cannot trust the data. The client wants to know what causes data sources to return different data.
Which tool should the client use to identify this issue?
- A. Ask Data
- B. Tableau Prep Conductor
- C. Tableau Resource Monitoring Tool
- D. Tableau Catalog
Answer: D
Explanation:
The Tableau Catalog is part of the Tableau Data Management Add-on and is designed to help users understand the data they are using within Tableau. It provides a comprehensive view of all the data assets in Tableau Server or Tableau Online, including databases, tables, and fields. It can help identify issues such as data quality, data lineage, and impact analysis. In this case, where different departments are getting different answers to the same business questions, the Tableau Catalog can be used to track down inconsistencies and ensure that everyone is working from the same, reliable data source.
References: The recommendation for using Tableau Catalog is based on its features that support data discovery, quality, and governance, which are essential for resolving data inconsistencies across different departments12.
When different departments report different answers to the same business questions using the same databases and tables, the issue often lies in how data is being accessed and interpreted differently across departments.
Tableau Catalog, a part of Tableau Data Management, can be used to solve this problem:
Visibility: Tableau Catalog gives visibility into the data used in Tableau, showing users where data comes from, where it's used, and who's using it.
Consistency and Trust: It helps ensure consistency and trust in data by providing detailed metadata management that can highlight discrepancies in data usage or interpretation.
Usage Metrics and Lineage: It offers tools for tracking usage metrics and understanding data lineage, which can help in identifying why different departments might see different results from the same underlying data.
References:
Tableau Catalog Usage: The Catalog is instrumental in providing a detailed view of the data environment, allowing organizations to audit, track, and understand data discrepancies across different users and departments.
NEW QUESTION # 50
For a new report, a consultant needs to build a data model with three different tables, including two that contain hierarchies of locations and products. The third table contains detailed warehousing data from all locations across six countries. The consultant uses Tableau Cloud and the size of the third table excludes using an extract.
What is the most performant approach to model the data for a live connection?
- A. Joining the tables in Tableau Prep
- B. Joining the tables in Tableau Desktop
- C. Blending the first two tables with the third
- D. Relating the tables in Tableau Desktop
Answer: D
Explanation:
For a performant live connection in Tableau Cloud, especially when dealing with large datasets that preclude the use of extracts, relating the tables in Tableau Desktop is the recommended approach. This method allows for flexibility in how the data is queried and can improve performance by leveraging Tableau's relationships feature, which optimizes queries for the underlying database.
References: The best practices for live connections in Tableau Cloud suggest using relationships to manage complex data models efficiently1. Additionally, Tableau's documentation on connecting data sources recommends using relationships for better performance with live connections2.
NEW QUESTION # 51
A client has a database that stores widget inventory by day and it is updated on a nonstandard schedule as shown below.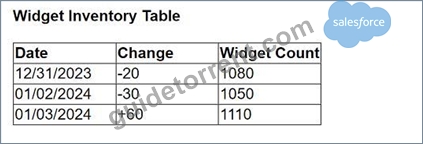
They want a data visualization that shows widget inventory daily, however their business unit does not have the ability to modify the data warehouse structure.
What should the client do to achieve the desired result?
- A. Update the Widget Inventory Table to be a daily snapshot.
- B. Use Tableau Desktop to visualize null values.
- C. Create a temporary table in the database.
- D. Use Tableau Prep to add new rows.
Answer: D
Explanation:
For a client who needs a daily visualization of widget inventory but cannot modify the data warehouse structure, the best approach is to use Tableau Prep to add new rows. Tableau Prep can be used to manipulate the existing dataset by adding missing date entries and appropriately adjusting inventory counts based on available data. This allows the creation of a complete daily snapshot for visualization without needing changes to the underlying database structure.
NEW QUESTION # 52
......
Latest Analytics-Con-301 dumps - Instant Download PDF: https://examcollection.guidetorrent.com/Analytics-Con-301-dumps-questions.html